In software development, there’s almost nothing more stressful than a hotfix—when a customer reports a bug that’s so severe everyone stops what they’re doing (no matter what time of day) to fix the bug.
Hotfixes interrupt workflows and seem to always happen at the worst times. Often, a series of hotfixes will drive software teams to ask themselves: why isn’t our QA team catching these, and how can we improve QA?
Following the business adage of “if you can’t measure it, you can’t improve it,” many teams start wondering what quality assurance metrics they should be tracking. A quick Google search will yield dozens of testing metrics you could track to evaluate your QA program, but most of them won’t actually help you improve QA because they simply measure QA activities—not QA results.
In this post, we’re going to keep it simple with five meaningful metrics for evaluating and improving QA that fall into two categories: metrics for tracking test effectiveness and metrics for tracking test efficiency.
- Escaped Bugs
- Test Coverage
- Test Reliability
- Time to Test
- Time to Fix
But first, let’s clarify the goal of QA.
Quality assurance is a balancing act between speed and quality
Before digging into the five essential QA metrics you should track to improve your QA efforts, it’s worth clarifying the goal of QA. The goal of quality assurance isn’t to catch every bug—because that’s impossible in most software development timeframes. The point of QA is to give you the confidence that your product meets a sufficient level of quality. (What’s sufficient? That’s up to you.)
That’s why it’s helpful to think of QA as a tradeoff between speed and quality. If you put too much emphasis on executing with speed, you sacrifice on quality and may end up with more hotfixes. On the other hand, if you put too much emphasis on fixing every possible bug before release, your development process will likely be too slow to keep your company competitive.
To find the right balance between speed and quality for your company, you’ll need a clear idea of:
- How many trivial, minor, major, and critical escaped bugs your company can afford on a regular (e.g., weekly) basis before they affect the bottom line or your reputation.
- How often you need to release new features and updates to stay competitive and maintain customer satisfaction.
Once you’ve defined these goals, you can use five straightforward software quality metrics to identify opportunities to improve your QA process to meet those goals.
The most useful QA metrics—meaning metrics that give you specific, actionable information—fall into two categories:
- Metrics that measure QA test effectiveness: When you run a series of tests, do the results accurately reflect the quality of the new release?
- Metrics that measure QA team efficiency: Is test management and test execution being handled as quickly as possible without sacrificing effectiveness?
Many metrics outside of these two categories aren’t worth tracking because they don’t tell you how to improve your QA efforts. A few commonly-cited metrics that we consider to be vanity metrics include:
- Hours spent on testing.
- Number of test cases in your test suite.
- Number of tests that pass in a given test run.
These metrics simply measure the QA activities your team is doing, but they don’t give you any information about the effectiveness or efficiency of your QA efforts.
Additionally, setting a goal of reducing (or increasing) any of these numbers on their own has almost no correlation to improved product quality. More hours testing doesn’t mean better test coverage, and fewer hours testing doesn’t mean more efficiency. For the former, it could just mean your team is wasting more time on irrelevant tests. For the latter, your team could be sacrificing sufficient test coverage for the sake of speed.
The fact is, only a handful of metrics will actually tell you what you need to know in order to improve software testing and align your team’s activities with quality and performance.
QA metrics for evaluating test effectiveness
The goal of software testing is to have confidence that the software product you’re about to release meets your quality standards. Ideally, passed tests would indicate quality software that’s ready for release and failed tests would indicate that the feature potentially needs more attention before being released—but that’s not always the case. That’s why we use QA metrics to help us evaluate how well our test results reflect the quality of the software.
Because quality is subjective, there is no absolute way to measure software quality—even the best QA metrics are only proxies for measuring quality. That being said, the following three metrics will give the best indication of how accurately your test results reflect the quality of your software.
QA metric #1: Escaped bugs
Escaped bugs are any bugs that make it to production after the testing cycle is complete. These bugs are usually caught and reported by customers or by team members after a feature goes live.
Tracking the number of bugs found after release to production is one of the best overall metrics for evaluating your QA program as a whole. If customers aren’t reporting bugs, that’s a good indication that your QA efforts are working. When customers do report bugs, it can help you identify specific ways to improve your QA testing.
If a bug escaped, it likely means your test suite missed it. This could happen for one of several reasons:
- The user path in question might not be covered by your current test suite.
- A test may exist for that user path, but it might be outdated or unreliable so the team doesn’t trust failed results and ignores it (we’ll talk more about this later).
- A test exists for that user path, but it’s designed in such a way that it passes even when certain issues are present.
In the first two cases, if the bug is critical enough, the solution is to add a test or fix the existing test so your team can rely on it. For the third case, you may need to look at how your test is designed—and consider using a tool that more reliably catches those bugs.
Why tools that test the underlying code miss more visual bugs
Most UI testing tools for web applications (like Selenium and Cypress) try to verify that an element is visible to the user by searching the underlying code of the page for a particular locator tag. If the test finds the element locator, the test will pass. However, there are reasons why the element locator can be present but the element won’t appear correctly to the end user:
- A bug could render the element off of the end user’s screen.
- A different element (like a popup) could be covering the element you’re testing for.
- The size of the element could be extremely small or extremely large.
In any of these scenarios, the test would be properly operating as-designed, but a real-life user would encounter an issue with the feature.
The best way to avoid these scenarios is to use a software testing tool—like Rainforest QA—that tests the visual layer rather than the underlying code.
Instead of searching for locators in the underlying code, Rainforest tests use pixel-matching to verify that an element is actually visible. Our virtual machines simulate a browser and interact with it just like an end-user would—by interacting with on-screen elements without touching the underlying code.
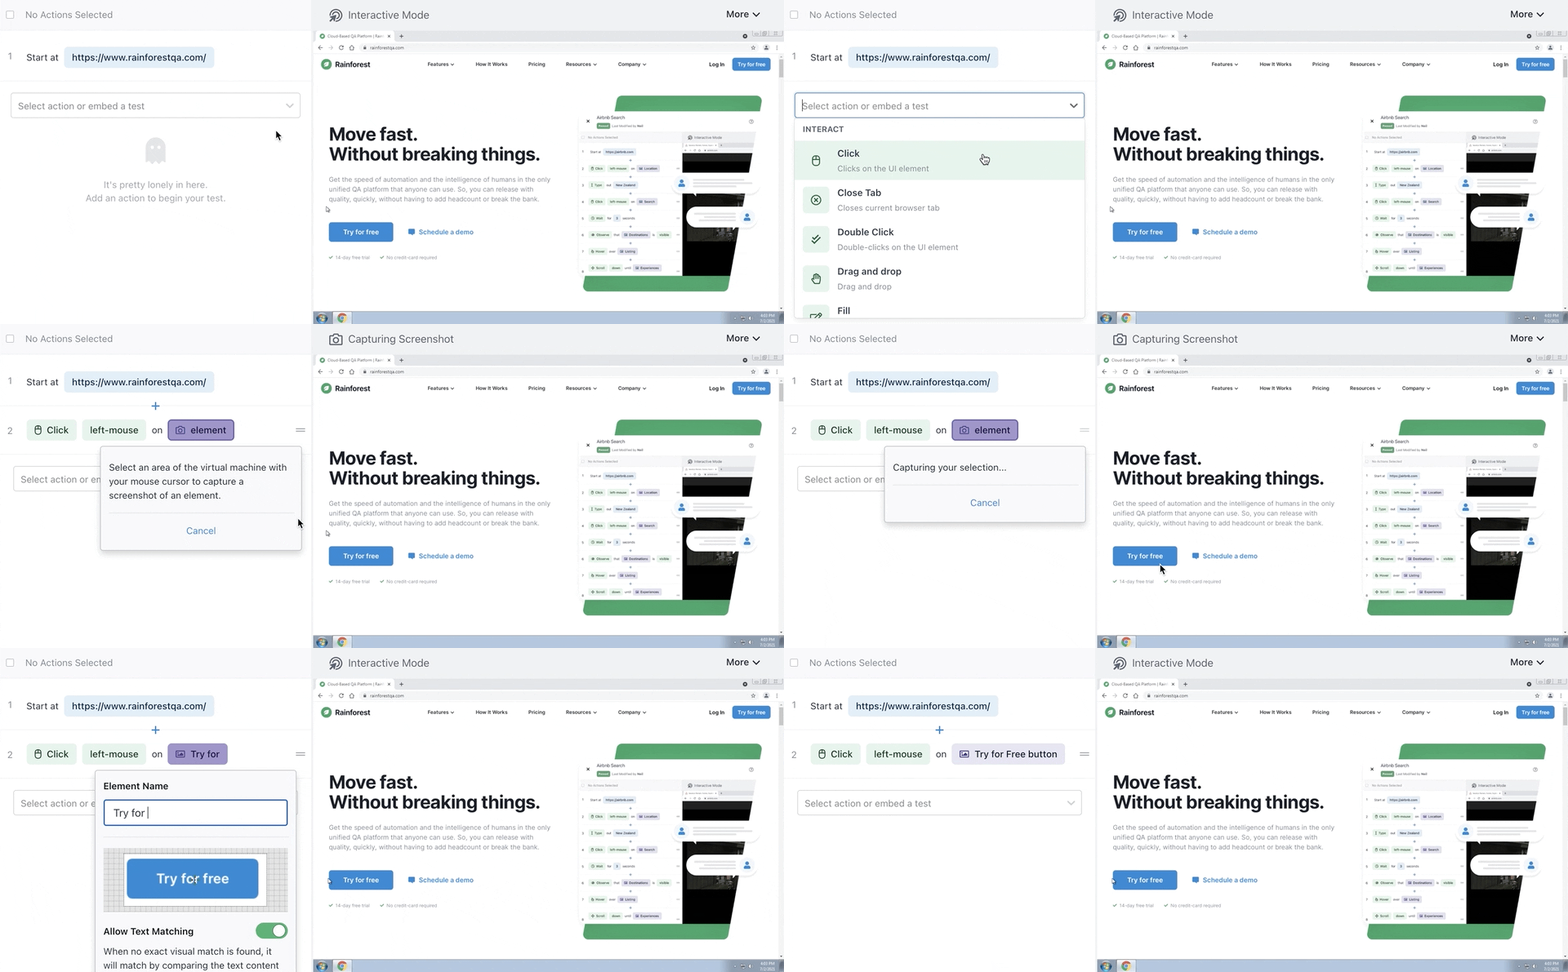
Rainforest is no-code, so to write or maintain any test step, you simply select a preset action (like “observe”, “select”, or “type”) and then click-and-drag to take a screenshot of the element you want to apply the action to.

Once you’ve created each step of the functionality you want to test, you can preview the actions you’ve defined to verify that the test will do what you intended. Then, when you’re ready to test, you launch it with the click of a button in the Rainforest platform, or a developer can kick it off via our API or CLI.
QA metric #2: Test coverage
While improving test coverage usually means creating more tests and running them more often, writing and running more tests isn’t the goal, per se.
If you’re not testing the right things with the right kind of test, more testing just means more work. You could have a test suite of 500 detailed tests and have less effective test coverage than someone who is covering the most critical features of their app with only 50 tests. That’s why the total number of tests in your test suite by itself isn’t a good reflection of your test coverage.
Instead of trying to cover 100% of your application, we recommend putting your testing efforts towards covering 100% of all critical user paths. We go into more detail about how to identify the most critical paths in this article, but the short version is to use the analogy of a snow plow clearing a city’s streets after a snowstorm. The streets that see the most traffic get cleared first, and some of the side streets may never get cleared because so few people travel on them.
In the same way, you should focus on building and maintaining tests to cover the most important user flows before trying to cover edge cases. If you’re not sure where to start, you can check your analytics platform (Google Analytics, Amplitude, etc.) to help prioritize your test coverage.
QA metric #3: Test reliability
A perfect test suite would have a perfect correlation between the number of defects and failed tests. A failed test would always include a real bug, and tests would only pass when the software was perfectly bug-free.
Measuring the reliability of your test suite means comparing your results to this standard. How often do your tests fail because of problems with the test, instead of real bugs? Do you have tests that pass sometimes, and fail other times, for no identifiable reason?
Tracking why tests fail over time—whether it’s poorly-written tests, test environment failures, or something else—will help you recognize patterns and identify where to make improvements.

QA metrics for measuring team efficiency
Instead of looking to simply minimize total test hours, tracking your team’s efficiency is about finding the fastest way to perform all the testing activities you’ve identified as being essential to maintaining baseline quality.
In this section, we’ll describe our favorite software testing metrics for tracking efficiency and show how Rainforest QA can help your team produce faster results without reducing quality.
QA metric #4: Time to test
‘Time to test’ is an indicator of how quickly your team can create and run tests for new features without affecting quality.
The tool you use for software testing will be a major factor that affects ‘time to test’. Automated testing is much faster than manual testing (we go into more detail about why automation is faster in this article and how to get started with automation in this article), so you’ll want to consider test automation if you haven’t already. When talking about these metrics, we’ll assume you’re using test automation.
Time to create tests
Creating automated tests using a no-code tool like Rainforest QA is faster than writing out lines of code for each action and assertion—even if you have programming experience. Rainforest QA also lets non-technical team members create and maintain tests without learning a new programming language just for testing. That means anyone can help create speedy automated tests while developers focus on building features.
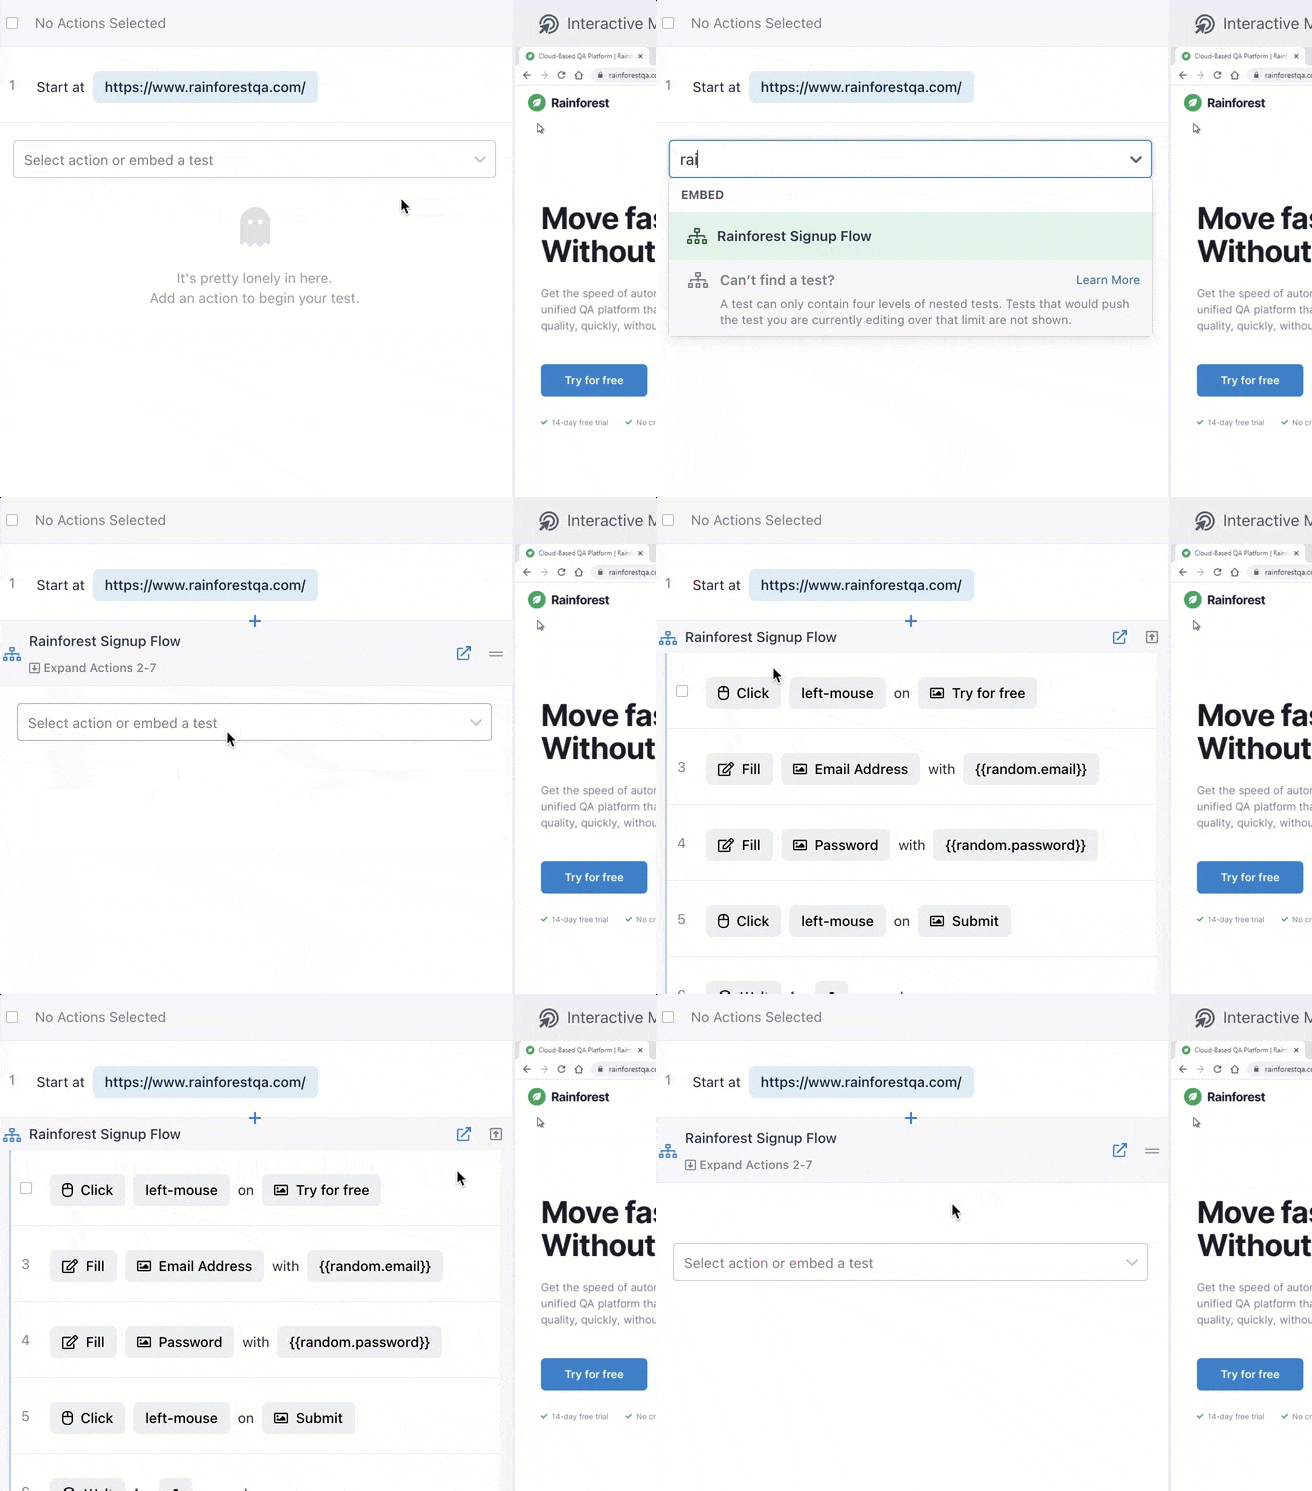
You can also embed one test in another to help speed up test creation. For example, if you create a test to cover a signup flow, you can embed those same steps in every other test that uses a signup flow by simply typing in the name of the test.

Time to run tests
When considering time to test as a metric, a lot of development teams focus on time in isolation of other factors (i.e. ‘these tests take an hour, let’s cut it down to 30 minutes’). A better way to approach the time it takes to test is to look for inefficiencies. This’ll help ensure you aren’t cutting corners on quality just to improve the speed of release.
When your test team kicks off a test run in Rainforest, all of the tests run in parallel on our network of virtual machines. A great way to cut out inefficiencies when you’re running automated tests in parallel is to make sure each test case only covers one feature. If you try to test too many functions in one test, you’ll end up with tests that take longer to run because features are being tested one after the other instead of simultaneously.
QA metric #5: Time to fix
‘Time to fix’ includes the time it takes to figure out whether a test failure represents a real bug or a problem with the test, plus the time it takes to fix the bug or fix the test. It’s best to track each of these metrics separately so you know which area is taking the most time.
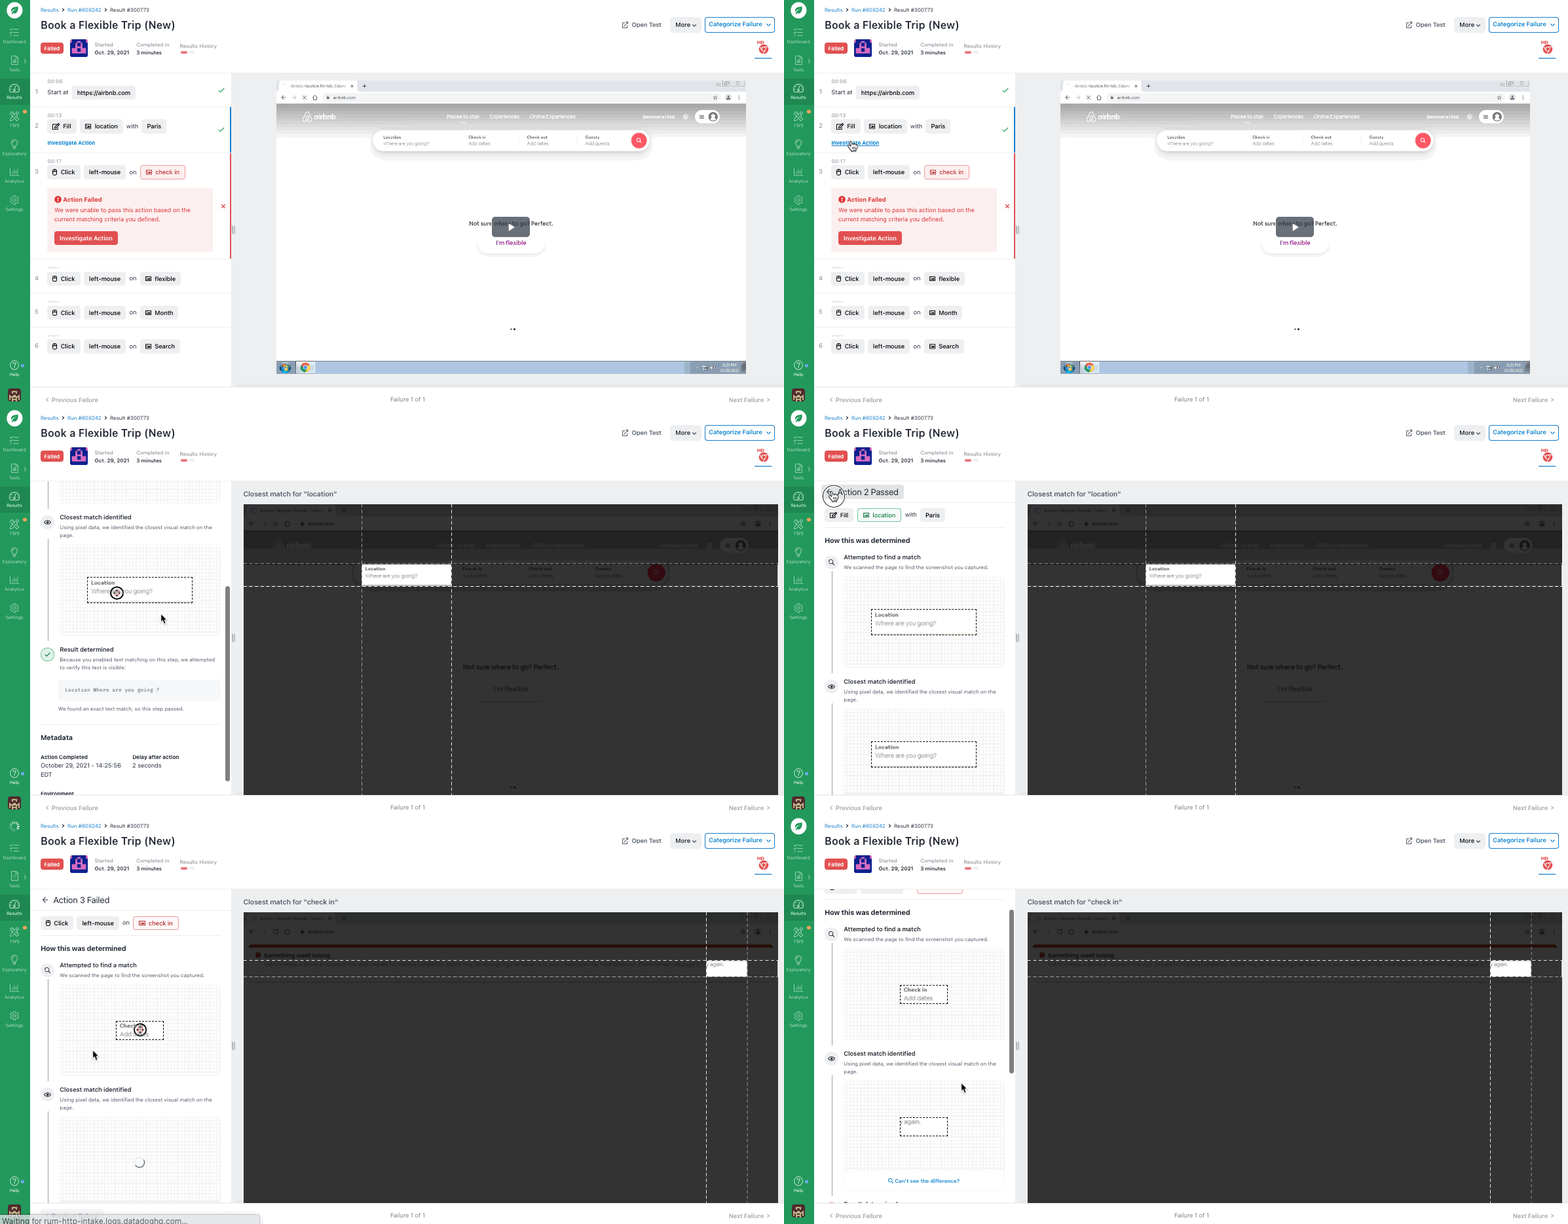
To help you identify why a test failed, Rainforest provides video replays of every test run (whether it passes or fails). With these videos, you can view the actual point of failure and everything leading up to (and following) it.

With most automated software testing tools, you’d have to sort through lines of code in order to identify why a test failed. With Rainforest, anyone can look at test results, know exactly what happened in the test, and quickly understand why the test failed.
Once you know why a test failed, fixing broken tests and debugging become the next priority.
If it’s a real bug that needs to be fixed, Rainforest QA offers a JIRA integration so you can automatically create a ticket for the development team that includes the failed test steps, a screenshot of the failed test step, HTTP logs, and a link to the full test results (including video recordings) in Rainforest.
It’s easy to quickly address broken tests in Rainforests since the app provides intelligent suggestions for fixes. And since it’s all no-code, anyone can do it.

Improve your quality assurance with Rainforest QA
Rainforest QA will help you catch more bugs that your customers care about and make the entire testing process—from writing tests to classifying test failures—move faster. It’s a scalable, all-in-one test automation solution that’s appropriate for small teams just getting started with automated testing or QA-mature teams regularly running 500+ software tests.
Talk to us about setting up a Rainforest plan that fits your needs.

